Executive Summary
Labor force participation rates in the United States have been on the gradual decline since peaking in the early 2000s, a trend that began to accelerate towards the end of the Great Recession and continued up until a recent uptick in 2016. Michigan labor force participation trends have followed a similar pattern, but mostly at lower rates and with steeper declines around economic downturns. Concerns over consistently decreasing rates of workforce participation after decades of gains have led researchers and officials grappling to find out what is driving the decline.
Labor force participation trends are often not as visible as the unemployment rate, but they nonetheless represent an important component in getting the full picture of the state of the labor market. Measured as a percent of the civilian labor force over 16 years old that is either employed or actively seeking employment, the labor force participation rate can indicate the level of confidence Americans have in the workforce. A complete copy of this policy brief (.pdf) can be downloaded here.
Labor Force Participation in the U.S.
Prior to the start of the decline in the early 2000s, rates of participation in the United States labor force had steadily increased for decades, in part owing to women and baby boomers entering the workforce at record levels beginning in the 1950s. While overall trends have followed similar patterns over time, levels of participation differ widely across geographic regions. Based on U.S. Census data from 2015, West Virginia ranked 50th lowest in workforce participation at 53.9%, while Alaska ranked 1st at 70.6%. With a participation rate of 61.3%, Michigan ranked near the bottom at 40th in workforce participation as compared to other states. As evidenced in the above map, geographic regions tend to share comparable levels of participation rates; clusters of lower-than-average workforce participation can be seen in the Southern and Southwest states, which house the ten lowest states in terms of labor force participation, with the exception of West Virginia. Conversely, the states with the top ten highest labor force participation rates are concentrated in the Central and Northeastern United States, with the exception of Alaska.
Labor Force Participation in Michigan
The differences in rural versus urban labor force particiation rates for 2015 are clear across the state of Michigan. Unsurprisingly, all Michigan counties with a major city have higher than average (61.3% or above) workforce participation, with the exception of Wayne County at 58.6% and Genesee at 57.6%. Kent County has the state’s highest rate of workforce particpation at 68.7%. The county with the lowest rate, araga County in the Upper Peninsula, has an unusually low rate of workforce  participation at 34.4% according to the 2015 data. In Baraga County, around 62% of residents are 54 years old or younger, compared with 69% in Kent County. In general, labor force participation across Northern Lower Michigan and the Upper Peninsual hover at lower-than-average rates, mostly around 40-45%.
Michigan Labor Force Participation Trends by Demographic Group
By Gender
Labor force participation rates for men and women in Michigan follow a similar trend between 2003 and 2016, but participation among men averaged around 17% higher than for women. Despite a recent uptick in preliminary 2016 data, labor force participation for men is around 7% lower and around 5% lower for women than in 2003. Since then, rates for both men and women have fallen by around a half percent each year on average.
By Race
Gender gaps in workforce participation persist across racial backgrounds, so comparisons in labor force participation by race are broken down by gender to gain a deeper understanding of existing disparities. For women over the time period 2003-20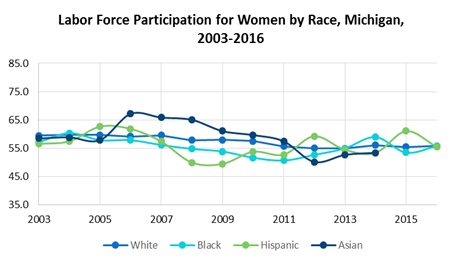 16, rates among White, Black, Hispanic and Asian women remain fairly steady and relatively comparable. Though some fluctuations emerge for Asian and Hispanic women, a smaller population for these groups in the state could be amplifying year-to-year variation. Overall, rates for women remain around 50-65% from 2003 to 2016.
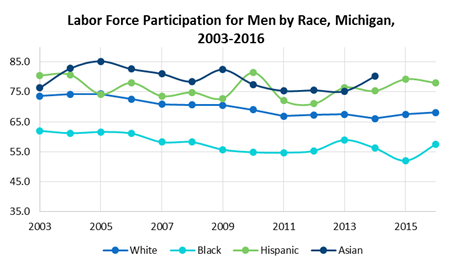
 For men, labor force participation disparities across races are more apparent. In Michigan, Hispanic and Asian men participated in the workforce at consistently higher levels than White and Black men over this time period. Furthermore, workforce rates for Black men averaged 57.7% for this time period and were 12.3% lower than rates for White men, 21.7% lower than Asian men, and 18.6% lower than Hispanic men. Again, prominent variability in trends for Asian and Hispanic men could be explained in part by smaller populations in the state relative to White and Black males.
By Educational Attainment
Labor force participation in Michigan is highly dependent on an individual’s level of educational attainment. Since 2009, rates for all categories—except those with a bachelor’s degree or higher---have continued on a pattern of gradual, steady decline. For those with at least a 4-year degree, however, the trend is reversed with a small, steady increase over this time period. The difference in workforce participation for this group compared with those with less than a high school education is stark; the rate for those without a high school degree from 2009-2015 was over 30% lower than the highest group, and waivered just above 50%. Overall, rates of participation in the workforce rise as educational attainment increases.
By Age
Workforce participation rates for prime-age workers (25-54) have followed steady rates of decline 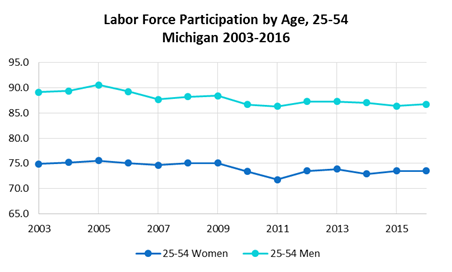 for both men and women between 2003 and 2016. Preliminary 2016 data show rates of participation for prime-age men at 86.7%, compared to 89.1% in 2003. For women, most recent 2016 rates reflect 73.5% of 25-54 year old females are participating in the labor market, compared to 74.9% in 2003. While both genders have experienced a decline over this time period, the overall decline for men has been around double that of women.
By contrast, those aged 55 and older have been one of the few demographic groups that have seen slight increases in overall workforce participation. Where workforce rates for prime-aged men decreased by around 3%, rates for men over the age of 55 increased by around 1%. For women, where workforce rates for prime-aged women decreased by around 2%, participation for women over 55 increased by around 1%. Individuals in Michigan over the age of 55 are one of the few groups to see an increase in labor force participation over this time period.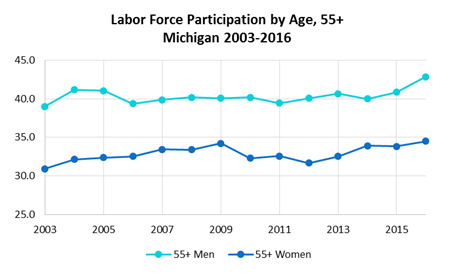
By Poverty Status
Poverty is also a major determinant of labor force participation in Michigan. Those living below the Federal 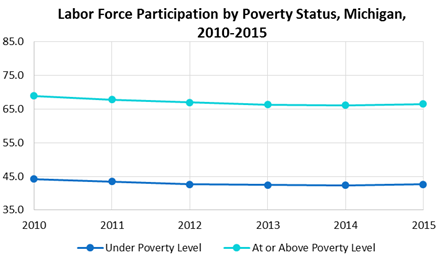 Poverty Line (FPL) averaged rates around 25% lower than individuals living at the FPL or above.
Since 2010, workforce rates for those living under the FPL have fallen by nearly 4%, slightly above a 3.5% decline for groups at or above the FPL. However, the rate of year-over-year declines for both groups have slowed.
Possible Reasons for Continued Labor Force Participation Decline
Demographics
A recurring explanation in researchers’ theories behind declining labor force participation rates has more to do with demographics than economics: an aging population. Since labor force participation rates are calculated as the percentage of the population 16 years and older that are participating in the labor force (i.e., the employed and the unemployed), an increasingly older population can play a role in depressing rates if more people are retiring than are entering the workforce. Analysis from the Congressional Budget Office suggest that an aging population accounts for 3.7% of the decline in labor force participation rates, a trend they project to continue over the next 30 years.
Despite this explanation being widely accepted as a primary driver, it fails to account for the decline in its entirety. Additionally, while a large portion of the Baby Boomer generation is and will continue to retire out of the workforce, figures 8 and 9 point to a slight upward tick in participation among those over the age of 55, suggesting that this age group may be staying in the workforce a little longer than earlier cohorts. However, these trends do not fully explain the decline in prime-age labor force participation, particularly among men.
Health
Another theory behind labor force participation decline claims that increased prevalence of poor h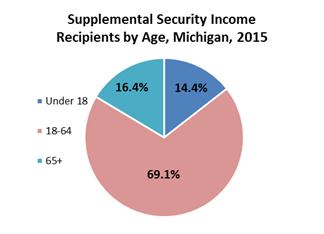 ealth is a culprit of declining participation. Beyond an aging population, increasing rates of disability for non-elderly adults is evident in increasing Supplemental Security Income (SSI) caseloads, a program that provides assistance to aged, blind, and disabled persons, and nearly 70% of which is made up of individuals under 65 years old in Michigan. Nationally, this program increased by 89% from 1990 to 2010.
In support of this theory, economist Alan Krueger’s study Where Have All the Workers Gone?[1] found that 43% of American men out of the labor force self-reported their health as “fair” or “poor”, compared to 12% of men in the labor force. In a survey of 571 men, the study found that 40% of men reported they were prevented from working full-time due to pain.
In Michigan, individuals with a disability not participating in the labor force rose by around 2% from 2009 to 2015, a slight uptick and part of a longer-term trend. Overall, around 32% of individuals in Michigan not participating in the labor force in 2015 reported living with a disability.
Incarceration
With steeper declines being seen in prime-aged white and black males, some researchers have suggested 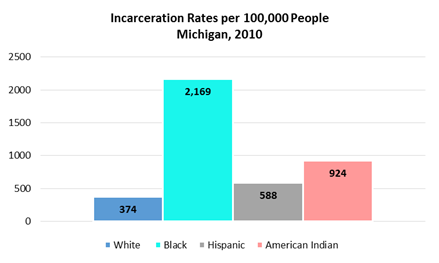 high incarceration rates have contributed to a diminished ability for many men to participate in the labor market, as a criminal record makes obtaining a job much more difficult. In a study on the impact of incarceration on the labor market from the left-leaning Center for Economic and Policy research, it was estimated that rates of employment for males in the United States dropped between 1.5% and 1.7% due to a prison record or felony conviction.
Based on 2010 U.S. Census data and calculated by the Prison Policy Initiative, incarceration rates per 100,000 people in Michigan are disproportionately African American. While this racial group makes up less than 15% of the state's population, African Americans make up nearly 50% of the state's prison population. In consideration of Michigan’s labor force participation gap for black males relative to other races referenced in Figure 6, high incarceration rates could prove to be partly to blame.
Conclusion
Michigan’s labor force participation rate has been on a steady decline since peaking in the 1990s, a movement that has followed a similar pattern across the country. In Michigan, however, that trend accelerated around the Great Recession, owing to the state’s severe job loss and subsequent discouragement. While overall workforce participation has nearly caught up to national averages, rates still remain considerably lower than they were in the early 2000s. For individuals with lower levels of education, people living under the poverty level, and for black men in Michigan, rates of participation in the workforce are consistently and exceedingly low relative to other groups. By contrast, some demographic groups in Michigan have actually seen labor force participation increases; those with high levels of education and older age cohorts for both males and females participated in the workforce in 2016 at levels slightly above those in 2003.
The aforementioned explanations for overall decreasing labor force participation rates provide a glimpse into what may be driving these trends, however, it remains unclear how much each contributes to the overall decline. An aging population, poor health, and high incarceration rates all likely play a role in driving individuals out of the labor market in Michigan.