In a number of cities across the state of Michigan, workers face substantial obstacles in finding affordably priced housing in close proximity to their place of work. This spatial mismatch between housing and employment opportunities contributes to long commutes, higher transportation costs, increased traffic congestion, reduced work productivity, and greater spatial inequality for racial minorities and low-income residents in the state.
Communities typically address issues of spatial mismatch through one of three strategies: encouraging the development of housing in communities with substantial employment opportunities, promoting economic development to expand employment opportunities in residential areas, and improving existing transportation systems to more affordably and efficiently connect housing and jobs. Addressing the undersupply of affordably priced housing in communities across the state of Michigan requires that planners and policymakers first understand the spatial distribution of housing and employment opportunities across the state. One central impediment to achieving these goals is the lack of easy-to-use tools for visualizing patterns of spatial mismatch.
With funding from the Institute for Public Policy and Social Research (IPPSR) at Michigan State University (MSU), my team at the School of Planning, Design and Construction (SPDC) designed an online data analysis and visualization tool – the Michigan Spatial Mismatch (MSM) Tool (http://MSMTool.spdc.msu.edu) – to facilitate detailed analyses of patterns of spatial mismatch across the state of Michigan. The goal of the MSM Tool is to assist Michigan policymakers and public officials in addressing jobs-housing mismatches through data-driven decision-making by allowing users to identify neighborhoods that are high priority areas for housing development fo Michigan's workforce or, conversely, high-priority areas for targeted economic development.
The MSM Tool allows users to 1) map imbalances in the number of residents and workers in neighborhoods across the state, 2) map disparities in the composition (e.g., income, race, etc.) of local residents and the local workforce, and 3) examine neighborhood-level physical, social, and economic conditions that might contribute to or be used to ameliorate these imbalances and disparities using data from the Longitudinal Employer-Household Dynamics Origin Destination Employment Statistics (LODES) compiled by the U.S. Census Bureau, OpenStreetMap, the Smart Location Database developed by the U.S. Environmental Protection Agency, and the American Community Survey (ACS).
For example, in the figure below we mapped housing-employment imbalances and racial disparities in the areas surrounding the city of Detroit. The areas with darker shading in Figure A have high numbers of workers but relatively low numbers of residents. The cities of Livonia and Troy, as well as downtown Detroit, stand out as places where housing development may be warranted to reduce the commute burden of workers. Areas with lighter shading, such as the northwestern and northeastern parts of Detroit, have high numbers of residents but low numbers of workers; here, economic development activity may be warranted to expand employment opportunities for workers.
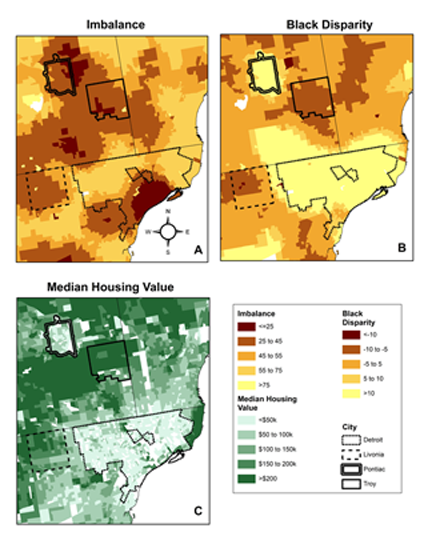
Figure B shows an alternative measure of spatial mismatch, the Black disparity index. In areas with darker shading, such as parts of the city of Livonia and most of the city of Troy, African Americans make up a relatively low share of residents but a higher share of workers. In other words, these are disproportionately white residential areas that rely on a Black workforce. The reverse is true of areas with lighter shading. In large swaths of the cities of Detroit and Pontiac, African Americans make up a disproportionate share of residents despite these cities’ dependence on a more racially diverse workforce.
The MSM Tool allows users to map imbalance and disparity indices for residents of different incomes, races, and education levels at four different spatial scales, from half-mile commute sheds to four-mile commute sheds. Users can also visualize demographic, physical, and economic characteristics of neighborhoods. For example, Figure C shows the median housing value in each neighborhood. When compared with Figures A and B, there is clear evidence highlighting a potentially important relationship between the cost of housing and jobs-housing imbalances and disparities for Black residents in the region. We invite you to try the MSM Tool for yourself to examine patterns of spatial mismatch in your region. Please feel free to contact us with questions or recommendations for the tool.
Noah J. Durst is an assistant professor in MSU’s Urban and Regional Planning Program. Having earned a doctorate in public policy from the Lyndon Baines Johnson School of Public Affairs at the University of Texas at Austin, Durst examines the effects of planning and policy-making on social equity, more recently focusing on U.S. housing markets.


